
(A) Supply schedule of chocolates
Price in ₹ | Quantity supplied in units |
10 | 200 |
15 | |
20 | 300 |
25 | 350 |
30 | |
35 | |
40 |
Ans:
1) Complete the above supply schedule.
Price in ₹ | Quantity supplied in units |
10 | 200 |
15 | 250 |
20 | 300 |
25 | 350 |
30 | 400 |
35 | 450 |
40 | 500 |
2) Draw a diagram for the above Supply Schedule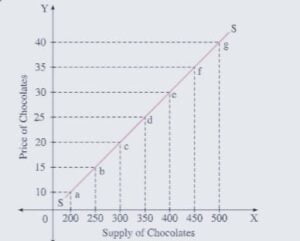
3) State the relationship between price and quantity supplied :
1) There is a direct relationship between price and quantity supplied.
2) The supply curve is a positive slope.
3) As the price increases the quantity supplied also increases.
4) At the lowest price 10 quantity supplied is less 200, at the highest price 40 the quantity supplied us the highest 500.
5) Supply curve moves upward from left to right.
(B)Observe the market supply schedule of potatoes and answer the following question:
Price in ₹ | Firms | Market supply (kg) | ||
A | B | C | ||
1 | ____ | 20 | 45 | 100 |
2 | 37 | 30 | 45 | _____ |
3 | 40 | ____ | 55 | 155 |
4 | 44 | 50 | ____ | 154 |
Ans:
1) Complete the quantity of potato supplied by the firms to the market in the above table.
Price in ₹ | Firms | Market supply (kg) | ||
A | B | C | ||
1 | 35 | 20 | 45 | 100 |
2 | 37 | 30 | 45 | 112 |
3 | 40 | 60 | 55 | 155 |
4 | 44 | 50 | 60 | 154 |
2) Draw the market supply curve from the schedule and explain it.
Ans : 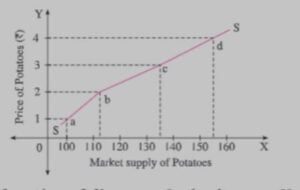
- X-axis represents quantity supplies of Potatoes and Y-axis represents the price of the Potatoes.
- Supply curve ‘SS’ slopes upwards from left to right which has a positive slope.
- It indicates a direct relationship between price and quantity supplied.